A brief history of color theory
The interaction experience map shows the customer’s path when working with a product or service. It also reflects behavior your competitors in relation to this path.
Mapping engagement from a customer perspective helps organizations identify strategic opportunities and weaknesses for client, as well as create innovative projects.
Why do you need a map of interaction experience?
The interaction map helps the organization see the bigger picture and decide where, based on research, focus their activities. Seeing the bigger picture, you can:
- Identify projects and build a roadmap
- Identify opportunities for innovation
- Understand where the user experience is currently well maintained
Conducting research
There are many types of research that can be used to help build a map. Some of them include:
- Ethnographic research
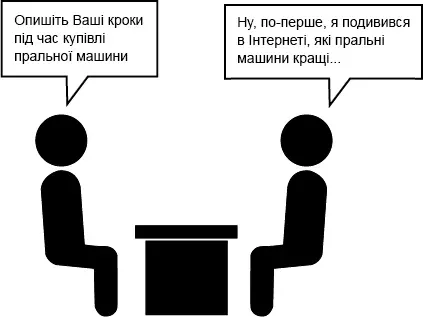
- In-depth interviews
- Guerrilla research
The way you conduct research can affect the quality of the data collected. But now we will not describe the research methodology users, as this is a completely different topic.
In an ideal world, you should analyze all the audio recordings from the interview. Analysis of this amount of data can take several weeks, depending on the number of studies. This is not ideal for a world where research is limited in budget and where it is important to be the first on the market.
An alternative approach is to interview two people. One person is responsible for conducting the interview, while the other makes detailed notes and notes. You can then use these records for analysis.
Research analysis
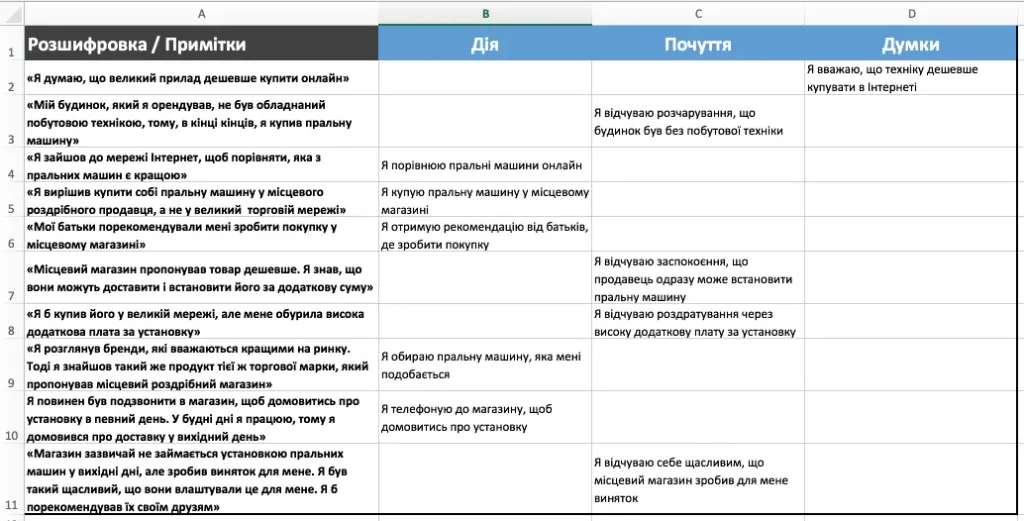
After the interview, open an Excel file or a Google spreadsheet. Comb your notes and choose what people do, feel and think.
It is important to write the phrases in a structured order, from the user’s point of view.
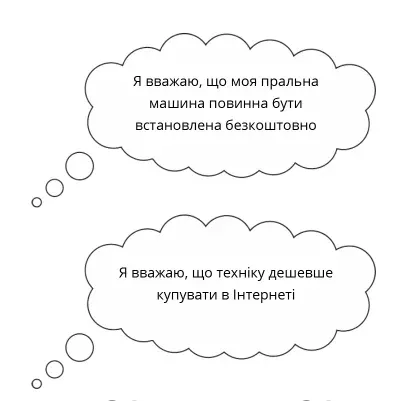
Action: I am a “verb”… Example: I am complaining about a product Feelings: I feel… Example: I get angry because of a broken product Opinions: I believe that… Example: I believe that the quality does not meet the requirements for the product
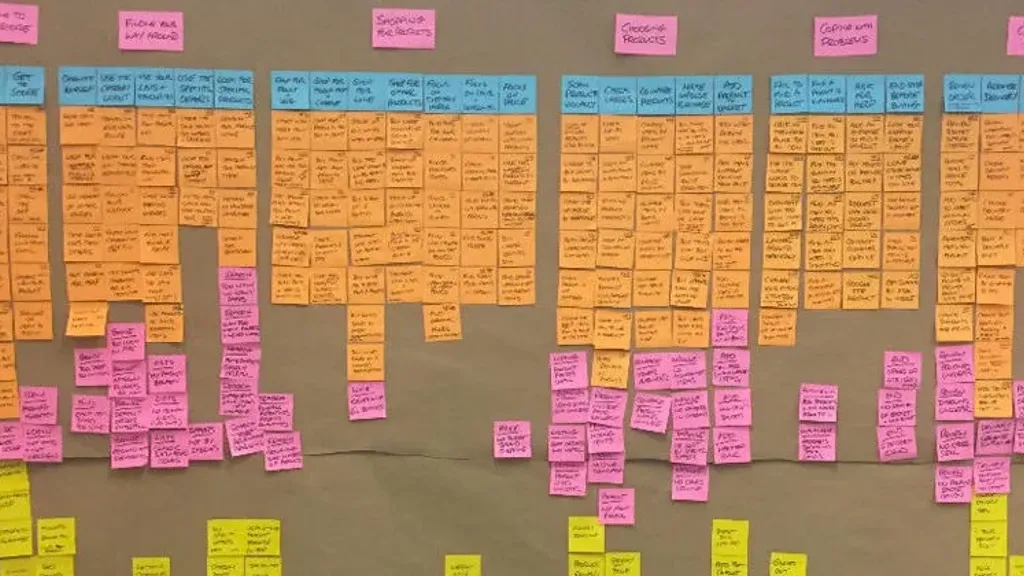
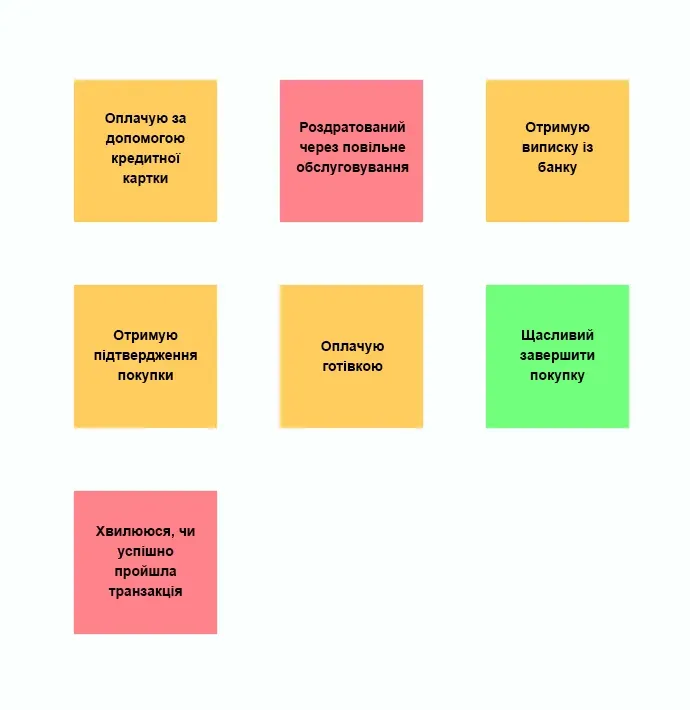
After you finish the analysis, write all the patterns of behavior and feelings on stickers for notes (post-it stickers). Delete “I” in the action list, and “I feel” in the recorded list of feelings to make the map less loaded and more legible.
Grouping of behavior and feelings
Group what people do (behave) and feelings based on customer tasks. Depending on the product or service, you may have 40-80 tasks. An example of a goal is when people “pay for a good.”
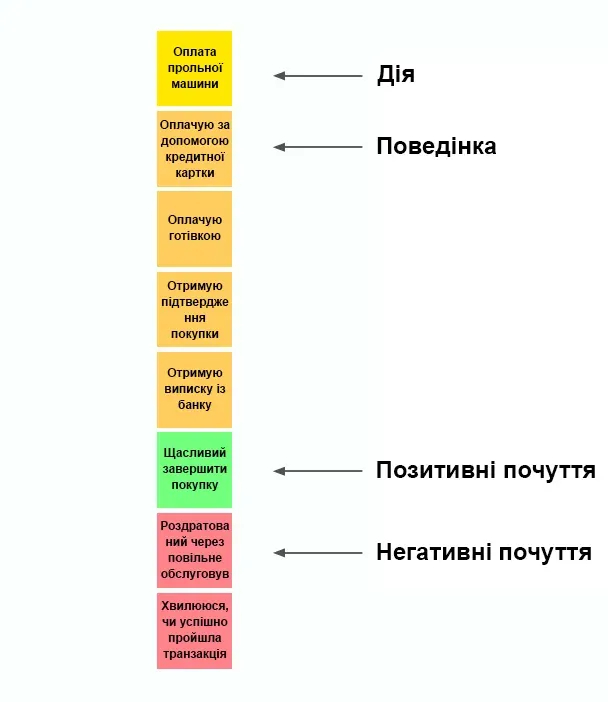
Highlighting priority behaviors and feelings
Under the tasks, place what people do (behavior), positive feelings and negative feelings.
Prioritize individual behaviors and feelings that best fit the task, or most often found in the comments.
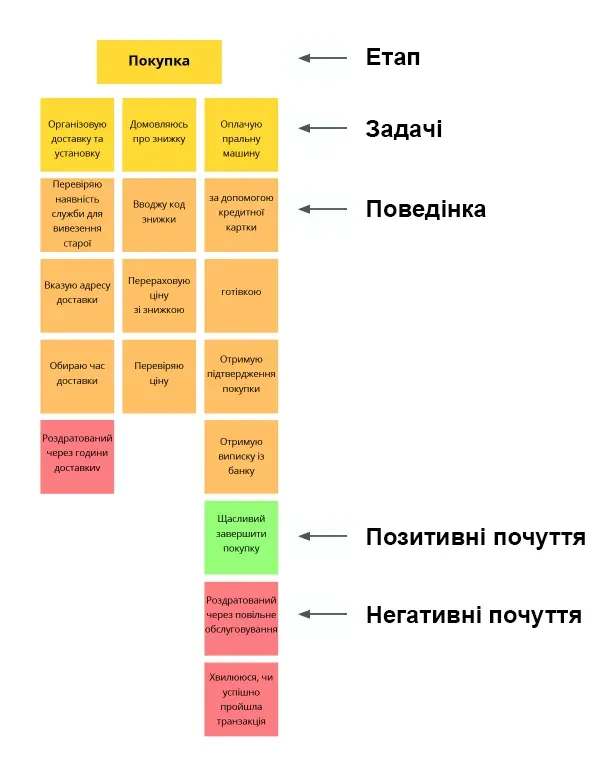
The order of tasks
No customer will demonstrate all the types of behavior that may occur when interacting with a product or service. The card collects all kinds of behavior, feelings and thoughts of all customers. In addition, not all people have these tasks in the same order.
You decide what to draw conclusions about the order of tasks, according to research. Once you have placed tasks in a certain sequence, divide them into groups or stages of interaction.
When naming stages, describe an action that occurs over a period of time.
Examples of names for stages: selection, purchase, etc.
Company overview
If you have a representative of different departments of the company, it will help you understand the main features of the product that affect on user behavior.
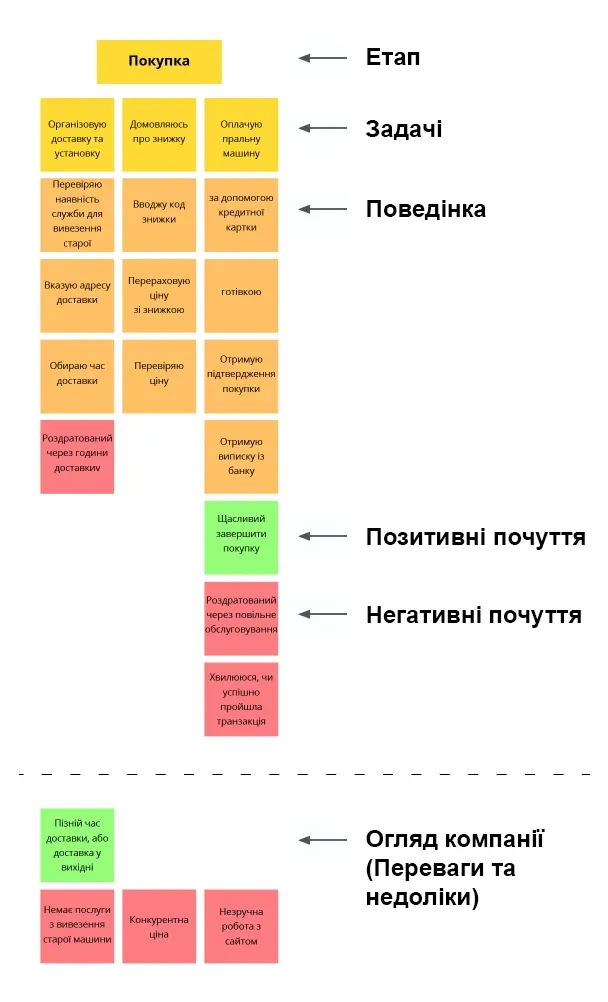
Review of competitors
Analyzing what your competitors are doing well is not so easy. The best way to do this is to do a longitudinal study.
Longitudinal (or longitudinal) research is a method of research by means of supervision in which data and supervision gather at a certain number of participants over a period of time.
Journal research is my favorite form of longitudinal research. They can last up to several weeks or months. This research captures interactions that may be invisible to your organization, such as relationships with competitors at a price.
In this case, we look for a number of highlights when interacting with a product or service to understand what are the strengths sides of our competitors. The most convenient way to collect these moments is for participants to use the mobile application. One of the applications that is worth mentioning is this nativeye.
An alternative to journal research may be to analyze competitors through desk research. However, they are will give much less understanding of what your competitors are offering to their customers.

Adding opinions about a product or service
Now it’s time to add what customers think of your product or service.
Write down from the analysis what customers think, and try to group similar “thoughts” on the stickers. Name each group a separate label that characterizes all these stickers. These stickers will represent people’s opinions about the product or service.
These thoughts should be off the map for two reasons. Mixing behavior, feelings and thoughts destroys the sequence of the card. In addition, people’s opinions are what they think of a product from a philosophical point of view, not from the point of view of its use.
Presentation of your company card
Once the map is complete, brainstorm with product owners to discuss roadmap ideas. Imagine this map first, going through each phase, including the characteristics of your company and competitors.
It is easy to forget that business decisions affect real people. When you present your card to people in your company, you need to tell stories that you have heard during user research.
By telling stories to management, you will increase the organization’s closeness to customers and help them accept more informed decisions in the future.
Identifying opportunities
Gaps will appear and show where a product or service does not match customer behavior. Strategically important issues will also become visible given the competition.

Creating a roadmap
No matter how much evidence you present to the organization when it comes to creating a roadmap, you have to consider other factors that come into play. The map of the experience of interaction is not a solution for domestic policy, but it will allow you to outline obvious data from customers as you work through priority tasks.
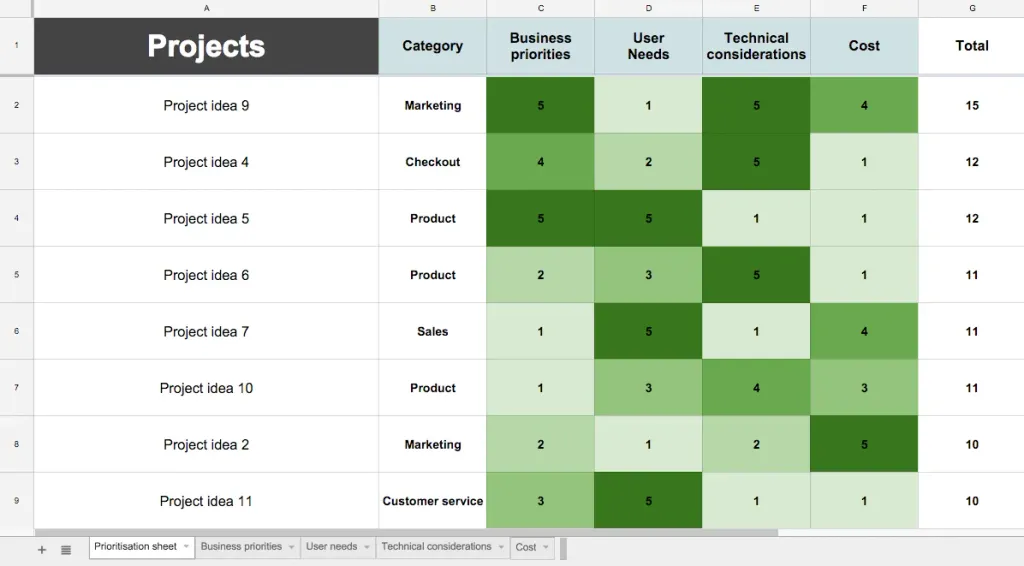
The first step in creating a roadmap is to prioritize your list of ideas. I recommend using a set of criteria to help prioritize potential projects. You can rate each project on based on a set of criteria.
Evaluation of potential projects is a subjective process, but the use of subject matter experts and any available ones data will help.
Example criteria: Technical aspects.
Subject Expert: Lead Developer.
Use separate tabs for expert comments to provide justification for each item. The man who will be make decisions, ask questions and study the topic further.
Prioritizing projects is not as easy as it seems, and it is not easy to evaluate each of them. Every initiative most likely has its own dependencies and limitations. Therefore, sometimes it will be more effective to group together some parts of the work.
At the end of the day, when you have a list of priority projects, you should make a plan based on what is most practical.
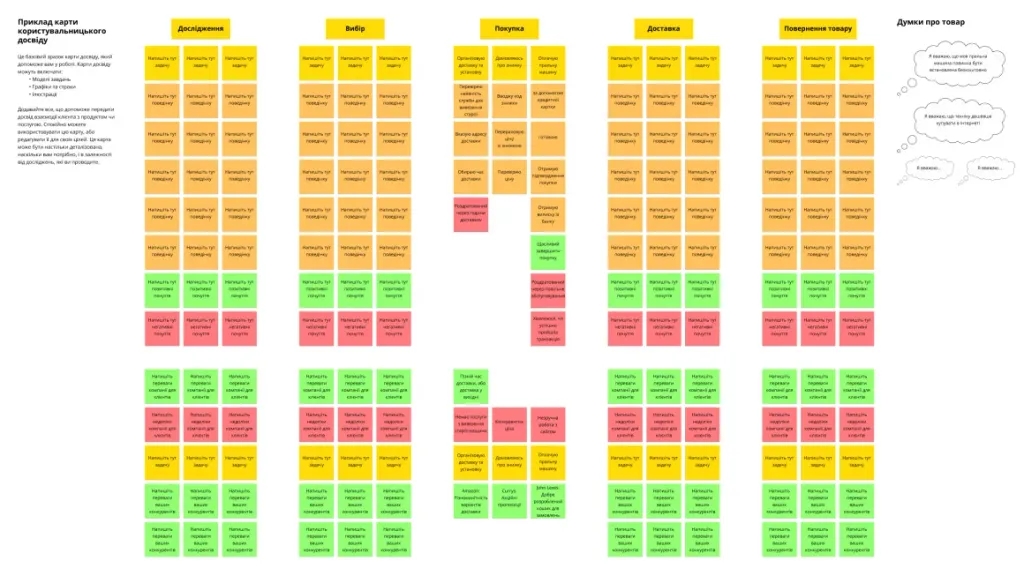
Example of an interaction experience map